"No alive nodes found in your cluster" in Magento 2.4

I followed all the instruction you have mentioned here How to install Magento 2.4 and build a web server and everything is working fine but No alive nodes found in your cluster when i test catalog search and check elasticsearh service and its failed but it was active before. I have fixed again and again but the same problem coming up after every 30 minutes. As no alive node found, product are not displaying in category. I need your help to fix the issue.–>

I am using elasticsearch 7.9

"name" : "Soinuko Node",
"cluster_name" : "Soinuko Cluster",
"cluster_uuid" : "yZyt3-RKTtcxcxnnnv",
"version" : {
"number" : "7.9.0",
"build_flavor" : "default",
"build_type" : "deb",
"build_hash" : "a479a2a7fce0389512d6a9361301708b92dff667",
"build_date" : "2020-08-11T21:36:48.204330Z",
"build_snapshot" : false,
"lucene_version" : "8.6.0",
"minimum_wire_compatibility_version" : "6.8.0",
"minimum_index_compatibility_version" : "6.0.0-beta1"
},
"tagline" : "You Know, for Search" 

and my database name is soinuko not magento.–>

Hi @ADMeetei and welcome

Just so you know, Magento 2.4.0 has only been tested with Elasticsearch 7.6.x.

What steps are you doing when you say: “I have fixed again and again but the same problem coming up after every 30 minutes.”?

Restart elasticsearch after that reindex and work for few minutes.
After few minutes when i check elasticsearch test and its failed.

What’s the status output of Elasticsearch after is stops working? Run the following in the CLI:

systemctl status elasticsearch

sometime its failed and sometime its work when i restart…if its failed then make changes curl -X GET ‘http://localhost:9200’ and work again but same problem came up

Next time it happens, copy paste the the output from the last command I left. It’ll should give you a hint to what caused it to stop responding. If there isn’t much information provided with that one, then this one should give even more information:

journalctl -u elasticsearch.service -b -e

(You may have to Page Up/Down to locate the most recent log entries)

Started the issue, so i check with the command…

curl -X GET 'http://localhost:9200'
curl: (7) Failed to connect to localhost port 9200: Connection refused
journalctl -u elasticsearch.service -b -e
Hint: You are currently not seeing messages from other users and the system.
      Users in groups 'adm', 'systemd-journal' can see all messages.
      Pass -q to turn off this notice.
~
~
-- Logs begin at Fri 2020-10-16 06:21:09 UTC, end at Fri 2020-10-16 10:44:36 UTC. >
-- No entries --
lines 1-2/2 (END)
 systemctl status elasticsearch
● elasticsearch.service - Elasticsearch
     Loaded: loaded (/lib/systemd/system/elasticsearch.service; enabled; vendor prese>
     Active: failed (Result: signal) since Fri 2020-10-16 11:26:14 UTC; 10min ago
       Docs: http://www.elastic.co
    Process: 36735 ExecStart=/usr/share/elasticsearch/bin/elasticsearch -p ${PID_DIR}>
   Main PID: 36735 (code=killed, signal=KILL

this what i am getting…

Excellent, so we can see in that the Status of Elasticsearch output:

Active: failed (Result: signal) since Fri 2020-10-16 11:26:14 UTC; 10min ago

So because it’s failed then there should be a log as to why it failed.

  1. Did you run the journal command as root/superuser? Because I’d expect to see logs when the service failed.
  2. What are your servers specifications? I’m starting to think that Elasticsearch simply doesn’t have the Memory it needs to run.

root/superuser means the one i created in beginning… like craig?? Its 20.04 lts ubuntu, 4 GB / 2 CPUs 80 GB SSD disk 4 TB transfer.

  • root is the master user that you start off with
  • “superuser” is the user you create with “root” access.

For example, I always name my superuser “craig” in my videos. Which means I’m able to prefix commands with “sudo”. Therefore, you’d need to run:

sudo journalctl -u elasticsearch.service -b -e

To get the information that we’re after. Otherwise, you get the message that you posted above.

 sudo journalctl -u elasticsearch.service -b -e
Oct 16 11:26:11 ubuntu systemd[1]: Starting Elasticsearch...
Oct 16 11:26:12 ubuntu elasticsearch[36735]: OpenJDK 64-Bit Server VM warning: Option UseC>
Oct 16 11:26:14 ubuntu systemd[1]: elasticsearch.service: Main process exited, code=killed>
Oct 16 11:26:14 ubuntu systemd[1]: elasticsearch.service: Failed with result 'signal'.
Oct 16 11:26:14 ubuntu systemd[1]: Failed to start Elasticsearch.

Ok… Now you have a real lead and something to actually Google:

elasticsearch.service: Main process exited, code=killed>

The following posts look promising:

Monitoring Memory Usage

Installing htop

If you don’t have htop installed, just run the following as superuser:

sudo apt install htop
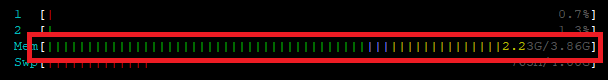
Running htop

If you wanted to, you could actually monitor the Linux Task Manager and watch your Memory usage completely fill up - And then you’d know the issue or at least rule it out.

Task Manager in Linux is ran with:

htop

You’ll find this in the upper-left.

image

ok let me check… thanks for the info… i will let you know if it can help me to fix the issue.

This topic was automatically closed 30 days after the last reply. New replies are no longer allowed.